
HackTwat
MuscleChemistry Registered Member
IGF-1 LEVELS AND SEXUAL FUNCTION: PART 1 OF 2
IGF-1 Levels are Significantly Correlated With Patient-reported Measures of Sexual Function</ARTICLE-TITLE> A W Pastuszak, J S Liu, A Vij, O Mohamed, K Sathyamoorthy, L I Lipshultz, M Khera
Int J Impot Res. 2011;23(5):220-226.
Abstract and Introduction
Abstract
Growth hormone (GH) supplementation may help to preserve erectile function. We assessed whether serum insulin-like growth factor 1 (IGF-1) levels, a surrogate for GH levels, correlate with sexual function scores in 65 men who completed the Sexual Health Inventory for Men (SHIM) and Expanded Prostate Cancer Index Composite (EPIC) questionnaires, and had serum IGF-1 and testosterone levels determined. Median±s.d. IGF-1 level, SHIM and EPIC scores were 235.0±86.4, 19.5±8.7 and 56.4±28.3 mg ml [SUP]−1[/SUP], respectively. IGF-1 levels and total SHIM score correlate significantly ( r=0.31, P=0.02), as do IGF-1 levels and all individual SHIM question scores, and IGF-1 levels and the sexual domain of the EPIC questionnaire ( r=0.30, P=0.02). No correlation was observed between IGF-1 levels and Gleason score, IGF-1 and testosterone level or SHIM score and testosterone level. These data support a potential role for the GH axis in erectile function.
Introduction
The male sexual cycle is regulated by a complex interplay between neuroendocrine, vascular and genital systems, and dysregulation of these systems can result in erectile dysfunction. The contributions of both vascular insufficiency and genital microstructural abnormalities to erectile dysfunction have been extensively studied, while the neuroendocrine axes have only recently come under scrutiny in the setting of male sexual function. [SUP][1,2][/SUP] The aging process is associated with a decline in serum testosterone levels, which when present together with symptoms of androgen deficiency is termed late-onset hypogonadism (LOH). [SUP][3][/SUP] The true prevalence of LOH remains uncertain, although a recent report suggests that LOH is present in 3.1–7.0% of men less than 70 years old, and up to 18.4% of men over the age of 70, when using total testosterone levels <300 ng dl [SUP]−1[/SUP] and symptomatic hypogonadism as diagnostic criteria. [SUP][4][/SUP]
Testosterone replacement in men with LOH has been shown to ameliorate the symptoms of LOH and results in improvements in erectile function without significantly increasing the incidence of clinically significant prostate cancer, although the mechanism of this improvement in erectile function remains incompletely elucidated. [SUP][3,5,6][/SUP] However, it does appear that this mechanism involves both local and central mechanisms. [SUP][7–13][/SUP] Growth hormone (GH) levels, like testosterone, are also known to decline in an age-dependent manner. [SUP][14][/SUP] This progressive decline has long been assumed to be physiological, although decline in GH secretion is associated with reduced lean body mass and bone density, an increased incidence of ischemic heart disease, dyslipidemia and erectile dysfunction, clinical outcomes that have also been observed in LOH. [SUP][15–21][/SUP] An association between low GH levels and erectile dysfunction has been described in otherwise healthy male subjects, and recent in vitro and animal studies suggest that GH upregulates nitric oxide (NO) and may thus help to maintain erectile function. [SUP][20,22–24][/SUP] The downstream effects of growth hormone are thought to be mediated in part by insulin-like growth factors 1 and 2 (IGF-1,-2), secretion of which is upregulated by GH. Given that the half-life of IGF-1 (12–15 h) is significantly longer than that of GH (less than 20 min), IGF-1 is considered to be a superior serum marker of growth hormone secretion and activity and is therefore used as a surrogate marker for GH levels, and has been validated as an accurate marker of GH levels over time. [SUP][25][/SUP]
Studies have shown that GH and testosterone levels are closely related and that boys with delayed puberty and healthy older men with low-normal testosterone and IGF-1 have increased serum GH and IGF-1 levels with exogenous testosterone treatment. [SUP][2,26][/SUP] IGF-1/GH and testosterone also appear to have similar clinical effects, with IGF-1/GH reversing endothelial progenitor cell dysfunction and testosterone increasing the number of endothelial progenitor cells. [SUP][27,28][/SUP] Thus, it is reasonable to expect that low GH levels will correlate with sexual dysfunction, and a link between GH levels and male sexual dysfunction has been demonstrated. [SUP][20,29][/SUP] This study builds on the current literature and examines a relationship between IGF-1 and validated measures of patient-reported sexual function, namely the Sexual Health Inventory for Men (SHIM) and the Expanded Prostate Cancer Index Composite (EPIC) questionnaires. [SUP][30,31][/SUP]
Methods
Patient Enrollment
The retrospective study protocol was approved by the Institutional Review Board of Baylor College of Medicine and 65 patients scheduled for radical prostatectomy between July 2007 and June 2008 from the practice of MK and LIL were included in the study. All subjects provided a preoperative blood sample for serum IGF-1 and testosterone levels between 1 week and 2 months before scheduled prostatectomy, and all samples were analyzed in the same laboratory (Baylor College of Medicine Department of Nuclear Medicine) using enzyme-linked immunosorbent assay in keeping with national standards for reproducibility and accuracy. Subjects were asked to complete the SHIM questionnaire as well as the sexual function domain portion of the EPIC questionnaires before prostatectomy. None of the subjects included in the study were treated with hormone ablation therapy for prostate cancer before or after completion of the above questionnaires.
Statistical Analysis
Statistical analysis of the data was performed using Statistical Package for the Social Sciences (SPSS), version 7.5, for Windows (Chicago, IL, USA) and Stata IE Version 10 for Macintosh (College Station, TX, USA). The distribution of data was determined using histogram analysis. Multivariate analysis was carried out using linear regression analysis. Spearman's correlation coefficients were calculated and P-values <0.05 were considered statistically significant.
Results
The median age of subjects included in the study was 58 years (range, 46–77 years) (). Associated comorbid conditions included hypertension (41.5% of patients), hyperlipidemia (46.2%), vasculopathy (4%), as defined by symptoms or objective measurements of coronary artery disease, carotid stenosis or peripheral vascular disease and diabetes mellitus with (14%) or without (0%) insulin dependence. Other concomitant conditions included current cigarette smoking (3%), a history of cigarette smoking (21%), occasional to moderate alcohol consumption (49%), depression (6%), erectile dysfunction before radical prostatectomy (29%) and testosterone replacement therapy before radical prostatectomy (3%). The most common Gleason score was 3+3 in 33 of 58 patients with pathology results available (Gleason score range 3+3 to 4+5).
Table 1. Patient characteristics
<TBODY>
</TBODY>Abbreviations: BMI, body mass index; ED, erectile dysfunction; EPIC, Expanded Prostate Cancer Index Composite; IGF-1, insulin-like growth factor 1; RP, radical prostatectomy; SHIM, Sexual Health Inventory for Men; TRT, testosterone replacement therapy.
To assess whether validated questionnaires for self-reporting of sexual function correlate with IGF-1 levels, serum IGF-1 levels were correlated with SHIM questionnaire scores. The median±s.d. serum IGF-1 level across the subject pool was 235.0±86.4 ng dl [SUP]−1[/SUP] (range 87–506 ng dl [SUP]−1[/SUP]) (). The median±s.d. SHIM questionnaire score was 19.0±8.7 (range 1–25). After the data distribution had been determined to be non-parametric using histogram analysis, Spearman's rank correlation coefficients were calculated between IGF-1 and SHIM scores. There was a significant correlation between IGF-1 levels and total SHIM scores for all ages ( r=0.31 P=0.02) (, Figure 1). Notably, there was also a significant correlation between IGF-1 level and score for each individual SHIM question for all ages (, SHIM 1—SHIM 5). Stratification based on subject age demonstrated a significant correlation between IGF-1 level and SHIM score in men >70 years old for total SHIM score ( r=0.89, P=0.04) and all individual questions (). In contrast, no significant correlation was demonstrated between IGF-1 level and total SHIM score for any other age group, although a correlation approaching statistical significance was observed in the 50–59-year-old age group for total SHIM score ( r=0.32, P=0.08), a significant correlation was observed for the second SHIM question (SHIM 2, r=0.41, P=0.02) in this age group. Although it is unclear why no statistically significant correlation between questionnaire scores and IGF-1 levels in younger age groups is observed, there are no significant differences in IGF-1 levels between age groups, while EPIC and SHIM scores were relatively higher in younger men, which may affect the correlation between IGF-1 levels and questionnaire scores in these age groups. Taken together, these data suggest that the >70-year-old age group is the most sensitive demographic to assess using the SHIM questionnaire if aiming to determine whether sexual function is related to IGF-1 levels, although the SHIM score may also be predictive in other age groups based on the isolated finding in the 50–59-year-old group. In addition, we should also consider the possibility that the statistically significant differences observed in our subgroups could result simply from chance. Larger population studies may better clarify the age-specific utility of IGF-1 levels as a predictor of sexual function.
Table 1. Patient characteristics
<TBODY>
</TBODY>Abbreviations: BMI, body mass index; ED, erectile dysfunction; EPIC, Expanded Prostate Cancer Index Composite; IGF-1, insulin-like growth factor 1; RP, radical prostatectomy; SHIM, Sexual Health Inventory for Men; TRT, testosterone replacement therapy.
Table 2. Spearman's correlation coefficients between IGF-1 and SHIM/EPIC scores, IGF-1 and testosterone, by age
<TBODY>
</TBODY>Abbreviations: IGF-1, insulin-like growth factor 1; EPIC, Expanded Prostate Cancer Index Composite; SHIM, Sexual Health Inventory for Men. 'R' represents the Spearman's correlation coefficient. 'EPIC sex' refers to the sexual domain portion of the EPIC questionnaire, whereas 'EPIC horm' refers to the hormonal domain. SHIM 1—SHIM 5 refer to individual questions of the SHIM questionnaire.
Table 3. Multivariate analysis assessing IGF-1 levels, age and comorbidities
<TBODY>
</TBODY>Abbreviation: IGF-1, insulin-like growth factor 1
Table 2. Spearman's correlation coefficients between IGF-1 and SHIM/EPIC scores, IGF-1 and testosterone, by age
<TBODY>
</TBODY>Abbreviations: IGF-1, insulin-like growth factor 1; EPIC, Expanded Prostate Cancer Index Composite; SHIM, Sexual Health Inventory for Men. 'R' represents the Spearman's correlation coefficient. 'EPIC sex' refers to the sexual domain portion of the EPIC questionnaire, whereas 'EPIC horm' refers to the hormonal domain. SHIM 1—SHIM 5 refer to individual questions of the SHIM questionnaire.
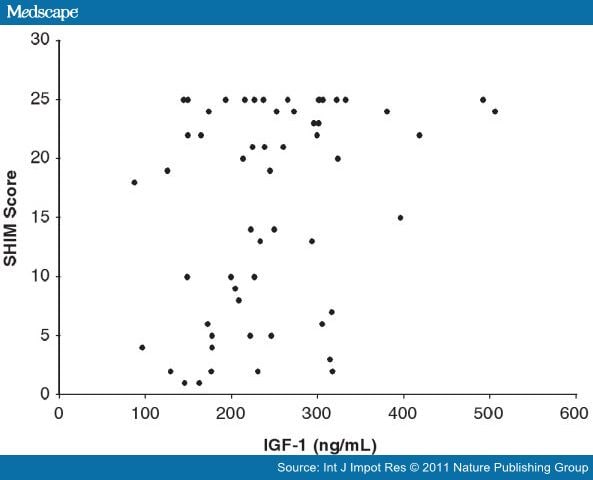
Figure 1.
Total Sexual Health Inventory for Men (SHIM) score vs serum insulin-like growth factor (IGF-1) level. All subjects' IGF-1 levels plotted against their self-reported scores of sexual function based on total SHIM score. There is a statistically significant correlation between the two measured values (Spearman's correlation coefficient, r=0.31; P=0.02).
IGF-1 Levels are Significantly Correlated With Patient-reported Measures of Sexual Function</ARTICLE-TITLE> A W Pastuszak, J S Liu, A Vij, O Mohamed, K Sathyamoorthy, L I Lipshultz, M Khera
Int J Impot Res. 2011;23(5):220-226.
Abstract and Introduction
Abstract
Growth hormone (GH) supplementation may help to preserve erectile function. We assessed whether serum insulin-like growth factor 1 (IGF-1) levels, a surrogate for GH levels, correlate with sexual function scores in 65 men who completed the Sexual Health Inventory for Men (SHIM) and Expanded Prostate Cancer Index Composite (EPIC) questionnaires, and had serum IGF-1 and testosterone levels determined. Median±s.d. IGF-1 level, SHIM and EPIC scores were 235.0±86.4, 19.5±8.7 and 56.4±28.3 mg ml [SUP]−1[/SUP], respectively. IGF-1 levels and total SHIM score correlate significantly ( r=0.31, P=0.02), as do IGF-1 levels and all individual SHIM question scores, and IGF-1 levels and the sexual domain of the EPIC questionnaire ( r=0.30, P=0.02). No correlation was observed between IGF-1 levels and Gleason score, IGF-1 and testosterone level or SHIM score and testosterone level. These data support a potential role for the GH axis in erectile function.
Introduction
The male sexual cycle is regulated by a complex interplay between neuroendocrine, vascular and genital systems, and dysregulation of these systems can result in erectile dysfunction. The contributions of both vascular insufficiency and genital microstructural abnormalities to erectile dysfunction have been extensively studied, while the neuroendocrine axes have only recently come under scrutiny in the setting of male sexual function. [SUP][1,2][/SUP] The aging process is associated with a decline in serum testosterone levels, which when present together with symptoms of androgen deficiency is termed late-onset hypogonadism (LOH). [SUP][3][/SUP] The true prevalence of LOH remains uncertain, although a recent report suggests that LOH is present in 3.1–7.0% of men less than 70 years old, and up to 18.4% of men over the age of 70, when using total testosterone levels <300 ng dl [SUP]−1[/SUP] and symptomatic hypogonadism as diagnostic criteria. [SUP][4][/SUP]
Testosterone replacement in men with LOH has been shown to ameliorate the symptoms of LOH and results in improvements in erectile function without significantly increasing the incidence of clinically significant prostate cancer, although the mechanism of this improvement in erectile function remains incompletely elucidated. [SUP][3,5,6][/SUP] However, it does appear that this mechanism involves both local and central mechanisms. [SUP][7–13][/SUP] Growth hormone (GH) levels, like testosterone, are also known to decline in an age-dependent manner. [SUP][14][/SUP] This progressive decline has long been assumed to be physiological, although decline in GH secretion is associated with reduced lean body mass and bone density, an increased incidence of ischemic heart disease, dyslipidemia and erectile dysfunction, clinical outcomes that have also been observed in LOH. [SUP][15–21][/SUP] An association between low GH levels and erectile dysfunction has been described in otherwise healthy male subjects, and recent in vitro and animal studies suggest that GH upregulates nitric oxide (NO) and may thus help to maintain erectile function. [SUP][20,22–24][/SUP] The downstream effects of growth hormone are thought to be mediated in part by insulin-like growth factors 1 and 2 (IGF-1,-2), secretion of which is upregulated by GH. Given that the half-life of IGF-1 (12–15 h) is significantly longer than that of GH (less than 20 min), IGF-1 is considered to be a superior serum marker of growth hormone secretion and activity and is therefore used as a surrogate marker for GH levels, and has been validated as an accurate marker of GH levels over time. [SUP][25][/SUP]
Studies have shown that GH and testosterone levels are closely related and that boys with delayed puberty and healthy older men with low-normal testosterone and IGF-1 have increased serum GH and IGF-1 levels with exogenous testosterone treatment. [SUP][2,26][/SUP] IGF-1/GH and testosterone also appear to have similar clinical effects, with IGF-1/GH reversing endothelial progenitor cell dysfunction and testosterone increasing the number of endothelial progenitor cells. [SUP][27,28][/SUP] Thus, it is reasonable to expect that low GH levels will correlate with sexual dysfunction, and a link between GH levels and male sexual dysfunction has been demonstrated. [SUP][20,29][/SUP] This study builds on the current literature and examines a relationship between IGF-1 and validated measures of patient-reported sexual function, namely the Sexual Health Inventory for Men (SHIM) and the Expanded Prostate Cancer Index Composite (EPIC) questionnaires. [SUP][30,31][/SUP]
Methods
Patient Enrollment
The retrospective study protocol was approved by the Institutional Review Board of Baylor College of Medicine and 65 patients scheduled for radical prostatectomy between July 2007 and June 2008 from the practice of MK and LIL were included in the study. All subjects provided a preoperative blood sample for serum IGF-1 and testosterone levels between 1 week and 2 months before scheduled prostatectomy, and all samples were analyzed in the same laboratory (Baylor College of Medicine Department of Nuclear Medicine) using enzyme-linked immunosorbent assay in keeping with national standards for reproducibility and accuracy. Subjects were asked to complete the SHIM questionnaire as well as the sexual function domain portion of the EPIC questionnaires before prostatectomy. None of the subjects included in the study were treated with hormone ablation therapy for prostate cancer before or after completion of the above questionnaires.
Statistical Analysis
Statistical analysis of the data was performed using Statistical Package for the Social Sciences (SPSS), version 7.5, for Windows (Chicago, IL, USA) and Stata IE Version 10 for Macintosh (College Station, TX, USA). The distribution of data was determined using histogram analysis. Multivariate analysis was carried out using linear regression analysis. Spearman's correlation coefficients were calculated and P-values <0.05 were considered statistically significant.
Results
The median age of subjects included in the study was 58 years (range, 46–77 years) (). Associated comorbid conditions included hypertension (41.5% of patients), hyperlipidemia (46.2%), vasculopathy (4%), as defined by symptoms or objective measurements of coronary artery disease, carotid stenosis or peripheral vascular disease and diabetes mellitus with (14%) or without (0%) insulin dependence. Other concomitant conditions included current cigarette smoking (3%), a history of cigarette smoking (21%), occasional to moderate alcohol consumption (49%), depression (6%), erectile dysfunction before radical prostatectomy (29%) and testosterone replacement therapy before radical prostatectomy (3%). The most common Gleason score was 3+3 in 33 of 58 patients with pathology results available (Gleason score range 3+3 to 4+5).
Table 1. Patient characteristics
| Variable | % (x/n) |
|---|---|
| Median age, years (range) | 58 (46–77) |
| Age | |
| <50 years | 6.2 (4/65) |
| 50–59 years | 49.2 (32/65) |
| 60–69 years | 33.8 (22/65) |
| >70 years | 10.8 (7/65) |
| Race | |
| White or Caucasian | 85.2 (23/27) |
| Black | 11.1 (3/27) |
| Hispanic | 3.7 (1/27) |
| Comorbid conditions | |
| Diabetes mellitus | 13.8 ( 9/65) |
| Hypertension | 41.5 (27/65) |
| Hyperlipidemia | 46.2 (30/65) |
| Coronary artery disease | 4.6 (3/65) |
| Depression | 6.2 (4/65) |
| Social history | |
| Cigarette smoking | |
| Non-smoker | 75.4 (49/65) |
| Previous history of smoking | 21.5 (14/65) |
| Current smoker | 3.1 (2/65) |
| Occasional to moderate alcohol consumption | 49.2 (32/65) |
| Sexual history | |
| ED before RP | 29.2 (19/65) |
| TRT before RP | 3.1 (2/65) |
| Mean BMI, n (range) | 27.6, 11 (20.0–37.8) |
| Prostate cancer Gleason grade | |
| 3 + 3 | 56.9 (33/58) |
| 3 + 4 | 27.6 (16/58) |
| 4 + 3 | 6.9 (4/58) |
| 4 + 4 | 3.4 (2/58) |
| 3 + 6 | 1.7 (1/58) |
| 4 + 5 | 1.7 (1/58) |
| Hormone levels | |
| Median total testosterone (ng dl [SUP]−1[/SUP]), s.d. | 358.0±136.4 |
| Median IGF-1 (mg dl [SUP]−1[/SUP]), s.d. | 235.0±86.4 |
| Questionnaire scores | |
| Median SHIM score, s.d. | 19.5±8.7 |
| Median EPIC sexual score, s.d. | 56.4±28.3 |
| Median EPIC hormonal score, s.d. | 10.0±1.5 |
<TBODY>
</TBODY>
To assess whether validated questionnaires for self-reporting of sexual function correlate with IGF-1 levels, serum IGF-1 levels were correlated with SHIM questionnaire scores. The median±s.d. serum IGF-1 level across the subject pool was 235.0±86.4 ng dl [SUP]−1[/SUP] (range 87–506 ng dl [SUP]−1[/SUP]) (). The median±s.d. SHIM questionnaire score was 19.0±8.7 (range 1–25). After the data distribution had been determined to be non-parametric using histogram analysis, Spearman's rank correlation coefficients were calculated between IGF-1 and SHIM scores. There was a significant correlation between IGF-1 levels and total SHIM scores for all ages ( r=0.31 P=0.02) (, Figure 1). Notably, there was also a significant correlation between IGF-1 level and score for each individual SHIM question for all ages (, SHIM 1—SHIM 5). Stratification based on subject age demonstrated a significant correlation between IGF-1 level and SHIM score in men >70 years old for total SHIM score ( r=0.89, P=0.04) and all individual questions (). In contrast, no significant correlation was demonstrated between IGF-1 level and total SHIM score for any other age group, although a correlation approaching statistical significance was observed in the 50–59-year-old age group for total SHIM score ( r=0.32, P=0.08), a significant correlation was observed for the second SHIM question (SHIM 2, r=0.41, P=0.02) in this age group. Although it is unclear why no statistically significant correlation between questionnaire scores and IGF-1 levels in younger age groups is observed, there are no significant differences in IGF-1 levels between age groups, while EPIC and SHIM scores were relatively higher in younger men, which may affect the correlation between IGF-1 levels and questionnaire scores in these age groups. Taken together, these data suggest that the >70-year-old age group is the most sensitive demographic to assess using the SHIM questionnaire if aiming to determine whether sexual function is related to IGF-1 levels, although the SHIM score may also be predictive in other age groups based on the isolated finding in the 50–59-year-old group. In addition, we should also consider the possibility that the statistically significant differences observed in our subgroups could result simply from chance. Larger population studies may better clarify the age-specific utility of IGF-1 levels as a predictor of sexual function.
Table 1. Patient characteristics
| Variable | % (x/n) |
|---|---|
| Median age, years (range) | 58 (46–77) |
| Age | |
| <50 years | 6.2 (4/65) |
| 50–59 years | 49.2 (32/65) |
| 60–69 years | 33.8 (22/65) |
| >70 years | 10.8 (7/65) |
| Race | |
| White or Caucasian | 85.2 (23/27) |
| Black | 11.1 (3/27) |
| Hispanic | 3.7 (1/27) |
| Comorbid conditions | |
| Diabetes mellitus | 13.8 ( 9/65) |
| Hypertension | 41.5 (27/65) |
| Hyperlipidemia | 46.2 (30/65) |
| Coronary artery disease | 4.6 (3/65) |
| Depression | 6.2 (4/65) |
| Social history | |
| Cigarette smoking | |
| Non-smoker | 75.4 (49/65) |
| Previous history of smoking | 21.5 (14/65) |
| Current smoker | 3.1 (2/65) |
| Occasional to moderate alcohol consumption | 49.2 (32/65) |
| Sexual history | |
| ED before RP | 29.2 (19/65) |
| TRT before RP | 3.1 (2/65) |
| Mean BMI, n (range) | 27.6, 11 (20.0–37.8) |
| Prostate cancer Gleason grade | |
| 3 + 3 | 56.9 (33/58) |
| 3 + 4 | 27.6 (16/58) |
| 4 + 3 | 6.9 (4/58) |
| 4 + 4 | 3.4 (2/58) |
| 3 + 6 | 1.7 (1/58) |
| 4 + 5 | 1.7 (1/58) |
| Hormone levels | |
| Median total testosterone (ng dl [SUP]−1[/SUP]), s.d. | 358.0±136.4 |
| Median IGF-1 (mg dl [SUP]−1[/SUP]), s.d. | 235.0±86.4 |
| Questionnaire scores | |
| Median SHIM score, s.d. | 19.5±8.7 |
| Median EPIC sexual score, s.d. | 56.4±28.3 |
| Median EPIC hormonal score, s.d. | 10.0±1.5 |
<TBODY>
</TBODY>
Table 2. Spearman's correlation coefficients between IGF-1 and SHIM/EPIC scores, IGF-1 and testosterone, by age
| Age group | IGF-1 vs | R | P-value |
|---|---|---|---|
| All ages | Total SHIM | 0.31 | 0.02 |

| SHIM 1 | 0.33 | 0.01 |
|
| SHIM 2 | 0.30 | 0.02 |
|
| SHIM 3 | 0.28 | 0.03 |
|
| SHIM 4 | 0.26 | 0.04 |
|
| SHIM 5 | 0.25 | 0.05 |
|
| EPIC sex | 0.30 | 0.02 |
|
| EPIC horm | −0.16 | 0.21 |
|
| Testosterone | −0.03 | 0.84 |
| >70 years | Total SHIM | 0.89 | 0.04 |
|
| SHIM 1 | 0.74 | 0.15 |
|
| SHIM 2 | 0.95 | 0.01 |
|
| SHIM 3 | 0.95 | 0.01 |
|
| SHIM 4 | 0.94 | 0.02 |
|
| SHIM 5 | 0.97 | 0.01 |
|
| epic sex | 0.87 | 0.06 |
|
| EPIC horm | 0.46 | 0.43 |
|
| Testosterone | 0.56 | 0.20 |
| 60–69 years | Total SHIM | 0.26 | 0.26 |
|
| SHIM 1 | 0.41 | 0.07 |
|
| SHIM 2 | 0.10 | 0.66 |
|
| SHIM 3 | 0.18 | 0.43 |
|
| SHIM 4 | 0.18 | 0.43 |
|
| SHIM 5 | 0.17 | 0.47 |
|
| EPIC sex | 0.19 | 0.41 |
|
| EPIC horm | −0.29 | 0.20 |
|
| Testosterone | 0.12 | 0.59 |
| 50–59 years | Total SHIM | 0.33 | 0.09 |
|
| SHIM 1 | 0.31 | 0.10 |
|
| SHIM 2 | 0.41 | 0.02 |
|
| SHIM 3 | 0.29 | 0.12 |
|
| SHIM 4 | 0.23 | 0.22 |
|
| SHIM 5 | 0.22 | 0.24 |
|
| EPIC sex | 0.32 | 0.08 |
|
| EPIC horm | −0.20 | 0.30 |
|
| Testosterone | −0.21 | 0.26 |
| 40–49 years | Total SHIM | −0.74 | 0.26 |
|
| SHIM 1 | −0.89 | 0.11 |
|
| SHIM 2 | NA | NA |
|
| SHIM 3 | −0.26 | 0.74 |
|
| SHIM 4 | NA | NA |
|
| SHIM 5 | NA | NA |
|
| EPIC sex | 0.32 | 0.68 |
|
| EPIC horm | 0.40 | 0.60 |
|
| Testosterone | 0.40 | 0.60 |
<TBODY>
</TBODY>
Table 3. Multivariate analysis assessing IGF-1 levels, age and comorbidities
|
| P-value |
|---|---|
| Age | 0.22 |
| Testosterone | 0.92 |
| Diabetes mellitus | 0.31 |
| Hypertension | 0.80 |
| Hyperlipidemia | 0.02 |
| Coronary artery disease | 0.17 |
| Smoking | 0.63 |
| Alcohol | 0.64 |
| Depression | 0.22 |
<TBODY>
</TBODY>
Table 2. Spearman's correlation coefficients between IGF-1 and SHIM/EPIC scores, IGF-1 and testosterone, by age
| Age group | IGF-1 vs | R | P-value |
|---|---|---|---|
| All ages | Total SHIM | 0.31 | 0.02 |
|
| SHIM 1 | 0.33 | 0.01 |
|
| SHIM 2 | 0.30 | 0.02 |
|
| SHIM 3 | 0.28 | 0.03 |
|
| SHIM 4 | 0.26 | 0.04 |
|
| SHIM 5 | 0.25 | 0.05 |
|
| EPIC sex | 0.30 | 0.02 |
|
| EPIC horm | −0.16 | 0.21 |
|
| Testosterone | −0.03 | 0.84 |
| >70 years | Total SHIM | 0.89 | 0.04 |
|
| SHIM 1 | 0.74 | 0.15 |
|
| SHIM 2 | 0.95 | 0.01 |
|
| SHIM 3 | 0.95 | 0.01 |
|
| SHIM 4 | 0.94 | 0.02 |
|
| SHIM 5 | 0.97 | 0.01 |
|
| epic sex | 0.87 | 0.06 |
|
| EPIC horm | 0.46 | 0.43 |
|
| Testosterone | 0.56 | 0.20 |
| 60–69 years | Total SHIM | 0.26 | 0.26 |
|
| SHIM 1 | 0.41 | 0.07 |
|
| SHIM 2 | 0.10 | 0.66 |
|
| SHIM 3 | 0.18 | 0.43 |
|
| SHIM 4 | 0.18 | 0.43 |
|
| SHIM 5 | 0.17 | 0.47 |
|
| EPIC sex | 0.19 | 0.41 |
|
| EPIC horm | −0.29 | 0.20 |
|
| Testosterone | 0.12 | 0.59 |
| 50–59 years | Total SHIM | 0.33 | 0.09 |
|
| SHIM 1 | 0.31 | 0.10 |
|
| SHIM 2 | 0.41 | 0.02 |
|
| SHIM 3 | 0.29 | 0.12 |
|
| SHIM 4 | 0.23 | 0.22 |
|
| SHIM 5 | 0.22 | 0.24 |
|
| EPIC sex | 0.32 | 0.08 |
|
| EPIC horm | −0.20 | 0.30 |
|
| Testosterone | −0.21 | 0.26 |
| 40–49 years | Total SHIM | −0.74 | 0.26 |
|
| SHIM 1 | −0.89 | 0.11 |
|
| SHIM 2 | NA | NA |
|
| SHIM 3 | −0.26 | 0.74 |
|
| SHIM 4 | NA | NA |
|
| SHIM 5 | NA | NA |
|
| EPIC sex | 0.32 | 0.68 |
|
| EPIC horm | 0.40 | 0.60 |
|
| Testosterone | 0.40 | 0.60 |
<TBODY>
</TBODY>
Figure 1.
Total Sexual Health Inventory for Men (SHIM) score vs serum insulin-like growth factor (IGF-1) level. All subjects' IGF-1 levels plotted against their self-reported scores of sexual function based on total SHIM score. There is a statistically significant correlation between the two measured values (Spearman's correlation coefficient, r=0.31; P=0.02).